
Mental Health
LA’s clinics are paving the way for integrated care by offering a range of behavioral health services on-site. The following section highlights expansions in mental health services provided by clinics.
The number of mental health visits provided by community clinics increased by 68% from 2012 to 2015. This increase occurred in 6 of the 8 SPAs, with the most dramatic gains occurring in SPA 6.
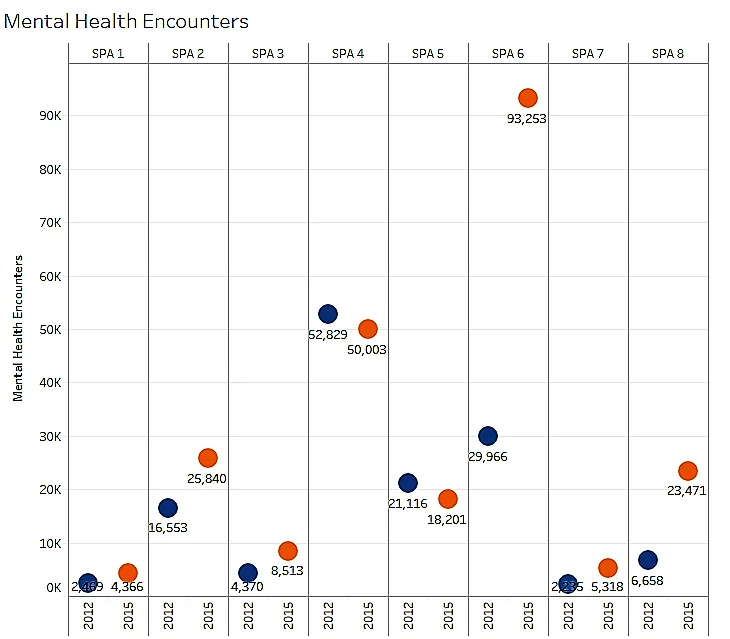
Source: OSHPD 2012 and 2015
Clinics increased capacity to provide mental health services by increasing the number of mental health providers (psychiatrists, clinical psychologists, and licensed social workers).
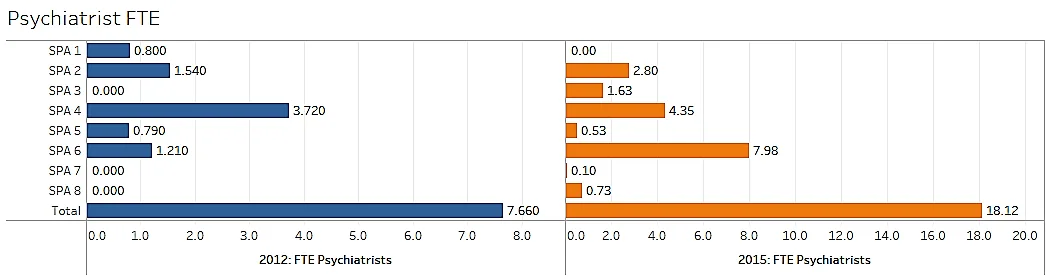
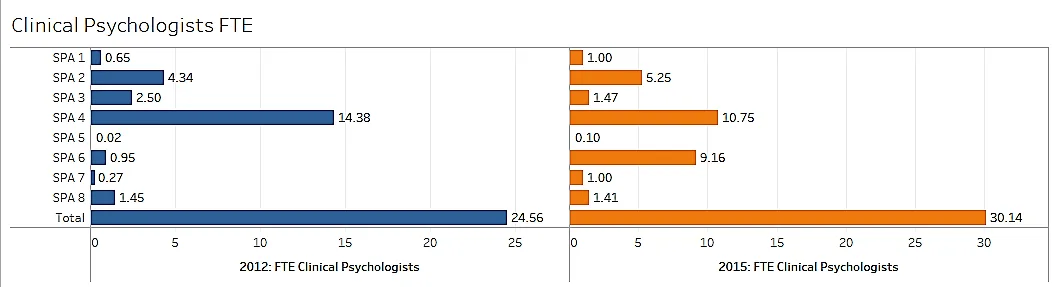
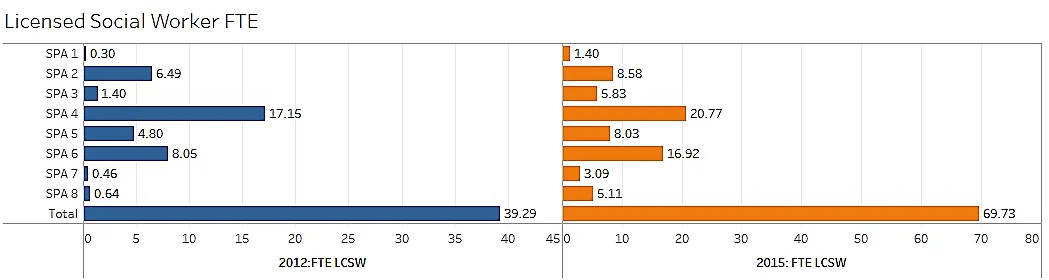
Source: OSHPD 2012 AND 2015
These are key findings from CCALAC’s 2018 Network Adequacy Report.
This project was funded by L.A. Care Health Plan to benefit low-income and uninsured residents of Los Angeles County.