
Dental
This section highlights expansions in dental services and remaining access challenges. Promising findings in dental care utilization reflect recent quality-focused initiatives at the clinics.
The number of dental visits provided by community clinics increased by 29% from 2012-2015. This increase occurred in all but one SPA.
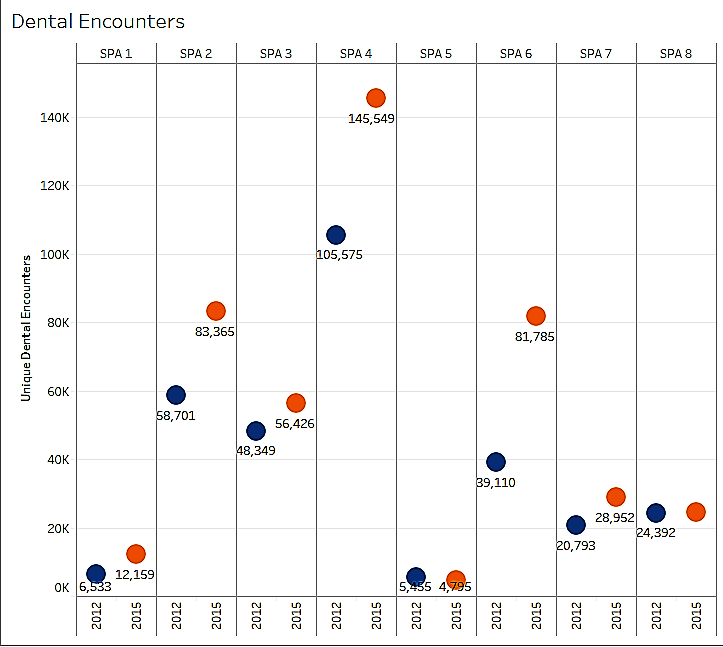
Source: OSHPD 2012 and 2015
The number of full-time dentists employed by health centers also increased dramatically.
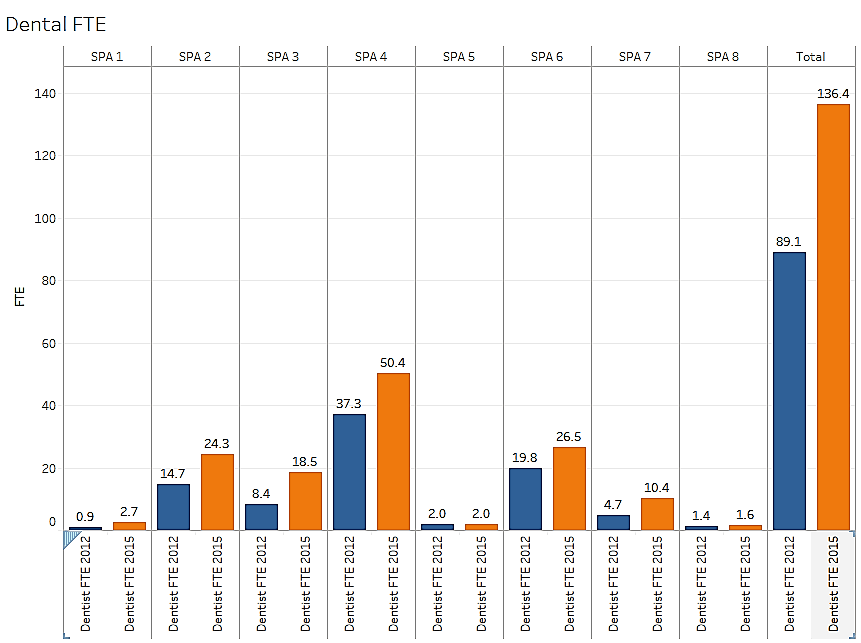
Source: OSHPD 2012 and 2015
Despite the enhanced role of community clinics in providing dental care, nearly two-fifths of adult residents in the County report not seeing a dentist or going to a dental clinic within the past year. In SPA 6, this proportion was 56%; SPA 7 also had a high proportion of adults not accessing dental care at 46.9%.
For children ages 0-17, roughly 1 in 10 did not access dental care in the last year for financial reasons. This proportion was highest in SPAs 1 and 6 at 14.2% and 15.5%, respectively.
These are key findings from CCALAC’s 2018 Network Adequacy Report.
This project was funded by L.A. Care Health Plan to benefit low-income and uninsured residents of Los Angeles County.
Related read: Blog – Extracting and Treating Los Angeles’ Dental Crisis at its Root