
Access
Los Angeles community clinics and health centers play a crucial role in offering comprehensive health care for low-income, underinsured, and uninsured community members, and are an important source of primary care for Medi-Cal patients. The following section outlines key findings in the areas of health coverage, the role of clinics in serving the newly insured, and remaining access challenges.
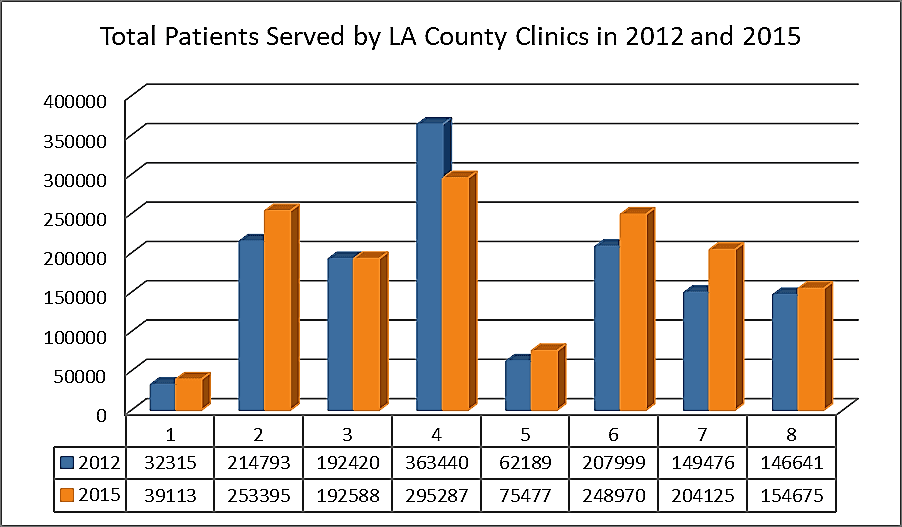
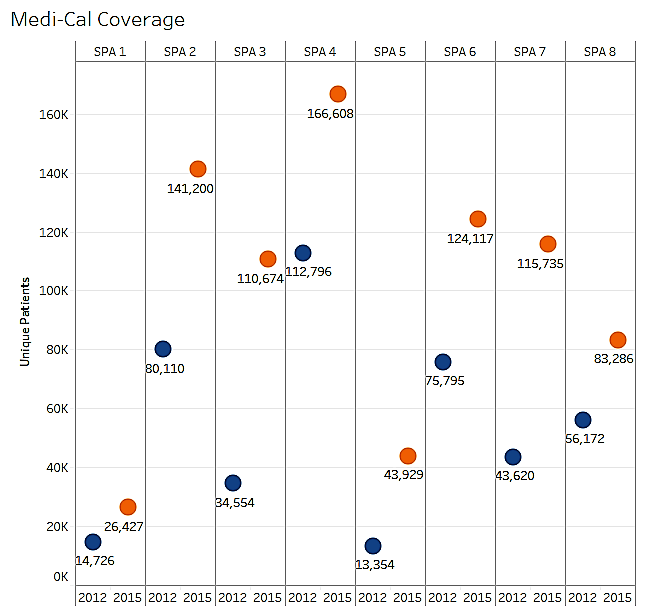
The total number of patients served increased in all service provider areas, regardless of payer status, except for one (SPA 4).
Overall, as expected, the rates of the uninsured declined and health coverage increased primarily via Medi-Cal. Similarly, the profile of patients in safety net clinics shifted from uninsured to Medi-Cal, and as shown in this report, safety net clinics continue to provide the bulk of care to uninsured persons and Medi-Cal beneficiaries in the County.
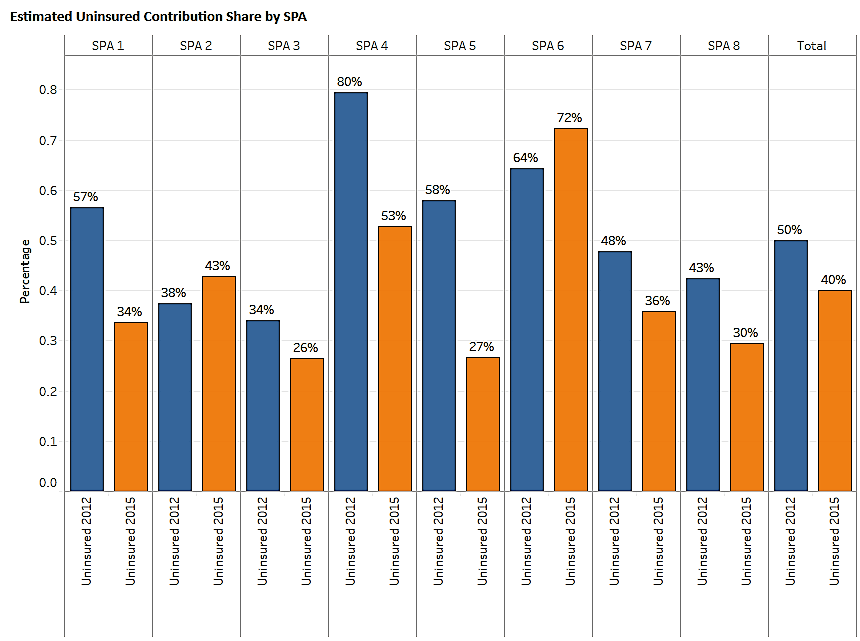
Community clinics provide nearly 44% of all Medi-Cal volume, and 41% of uninsured volume in the County. Moreover, in some of the eight Service Planning Areas (SPAs) of the County, safety net clinics provide 70% of the Medi-Cal and/or uninsured.
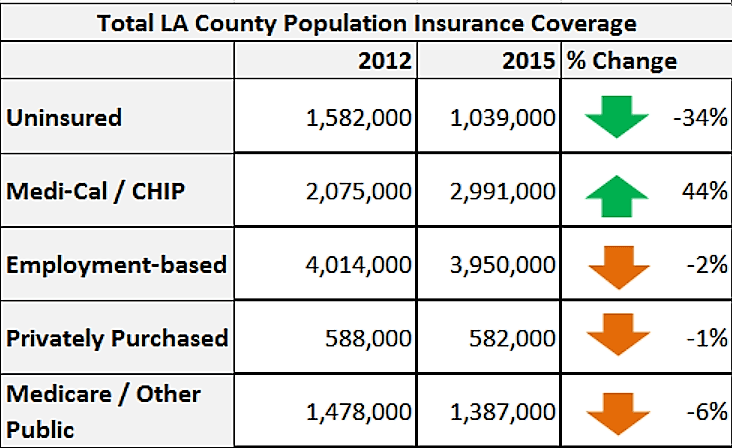
As expected with the expansion of Medi-Cal volume under the Affordable Care Act, the percentage of the population without insurance coverage decreased across LA County. Over half a million residents obtained some form of health insurance coverage. Employment-based coverage and Medicare/Other Public insurance coverage also decreased overall in the county between 2012 to 2015.
Across this period, the uninsured rate dropped from 23% to 14%, or from 1.58 million in 2012 to 1.04 million in 2015. The period shows a corresponding increase in the population covered under Medi-Cal or CHIP 16% (2.07 million) to 30% (2.99 million).
Source: CHIS 2012 and 2015
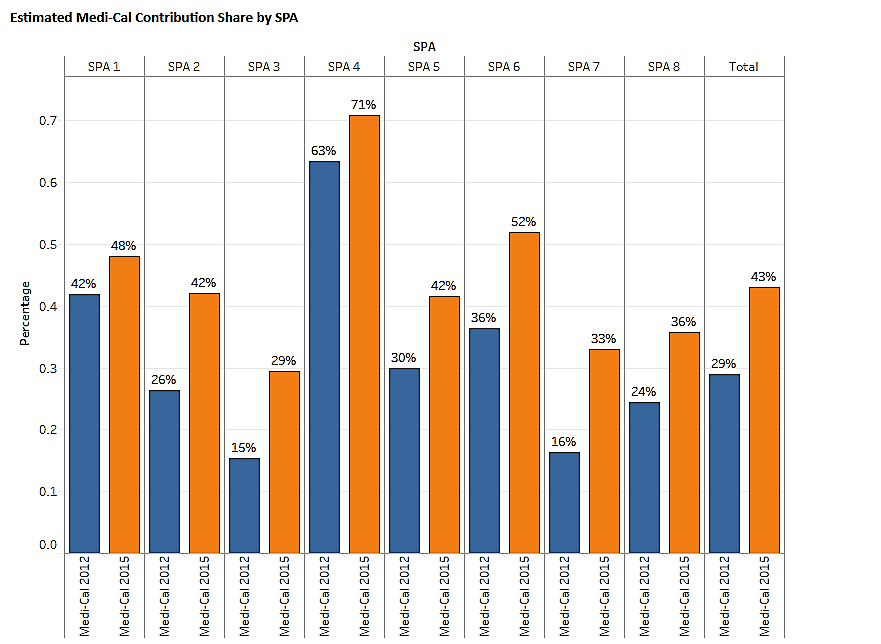
From 2012 to 2015, the share of safety net clinics’ service contribution in serving the County’s Medi-Cal population increased from 29% to 44%. Significantly, safety net clinics in five SPAs contribute more than 48% of all ambulatory care provided to the Medi-Cal population, and in two SPAs more than an estimated 50% contribution in care to the uninsured.
Source: OSHPD 2012 and OSHPD 2015, LAC DHS Enterprise Data Repository 2012 and 2015, and
CHIS 2012 and CHIS 2015
Source: OSHPD 2012 and OSHPD 2015, LAC DHS Enterprise Data Repository 2012 and 2015, and
CHIS 2012 and CHIS 2015
The following graph displays that a majority of the community clinic payer mix was made up of Medi-Cal and Medi-Cal managed care in 2012 and 2015
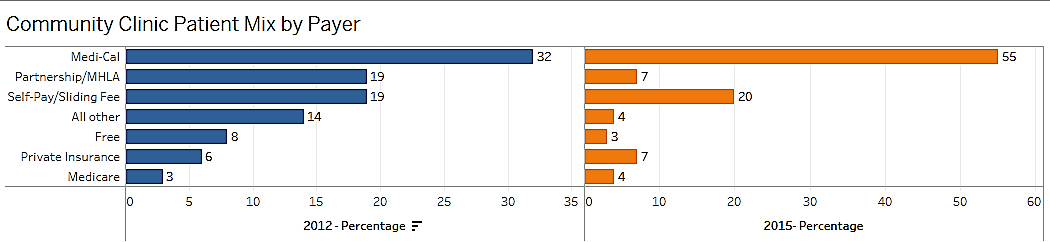
Source: OSHPD 2012 and 2015
Medi-Cal Patient Coverage
The number of LA County clinic patients covered by Medi-Cal Managed Care plans more than doubled between 2012 and 2015. In 2015, according to OSHPD data, at least 50% of the community clinic payer mix in every SPA was comprised of Medi-Cal and Medi-Cal managed care.
Source: OSHPD 2012 and 2015
Despite gains in coverage, challenges in accessing care persist, despite a significant decrease in uninsured rates in each SPA.

Source: Source: OSHPD 2012 and 2015

Source: CHIS 2012 and 2015
These are key findings from CCALAC’s 2018 Network Adequacy Report.
This project was funded by L.A. Care Health Plan to benefit low-income and uninsured residents of Los Angeles County.